Danish Space Statistic 2018
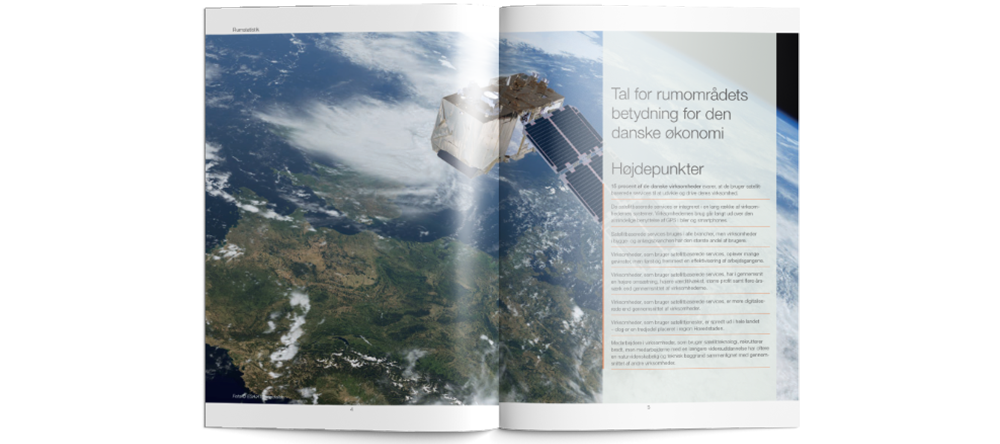
No one has ever tried to create a statistical overview of a country's space industry. A number of other countries where therefore looking at what was done, when Denmark publishes its first space statistics.
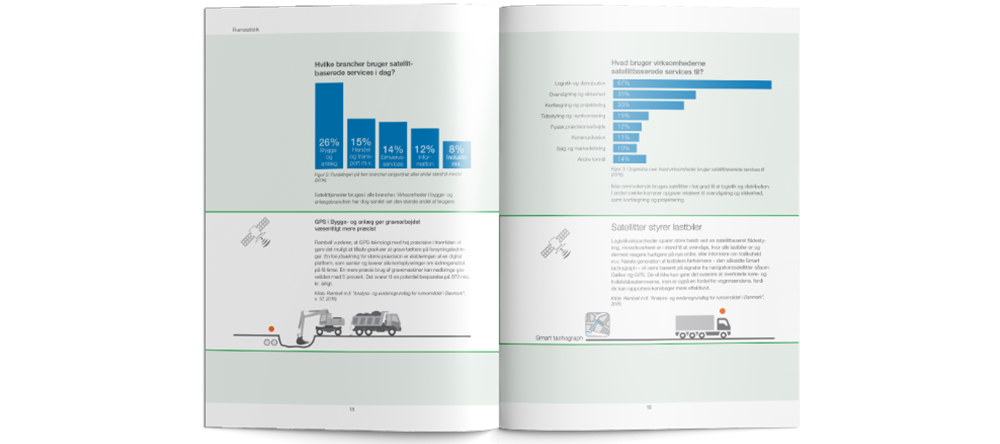
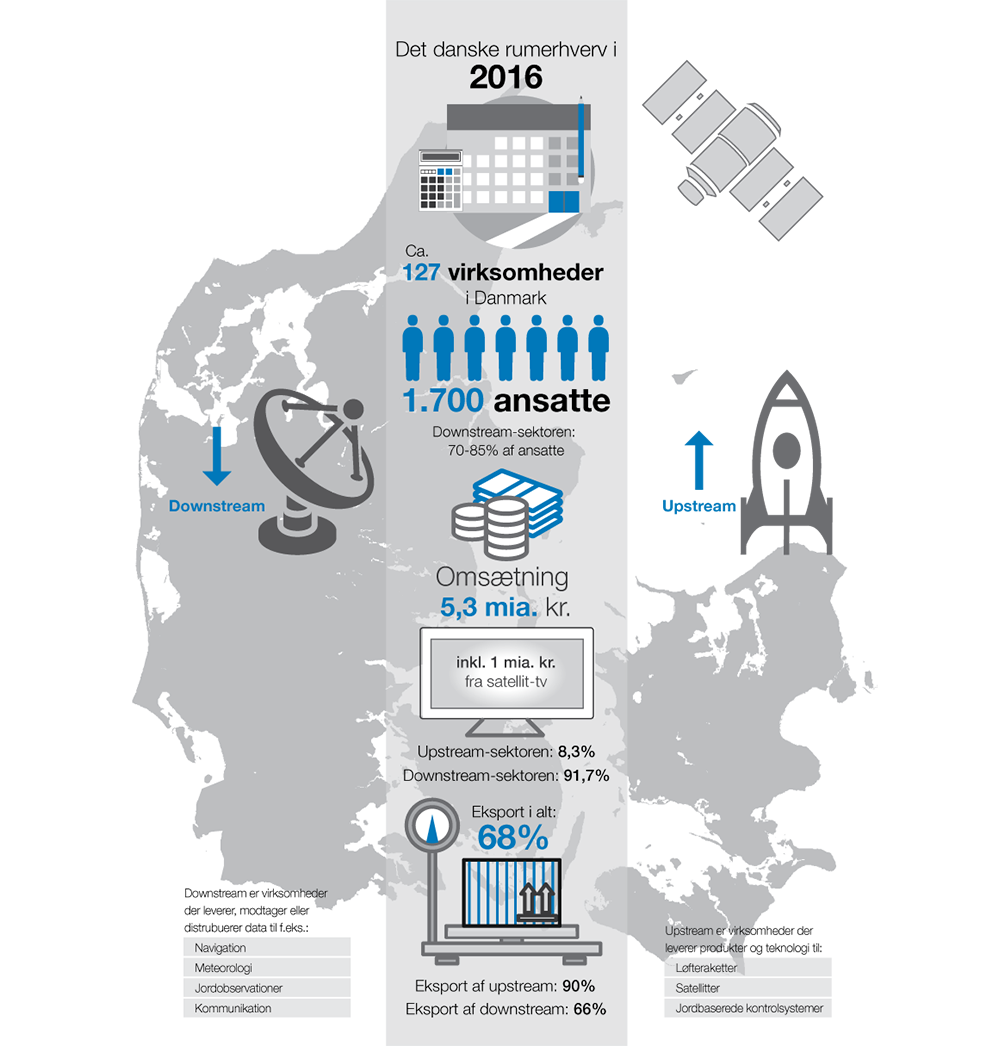
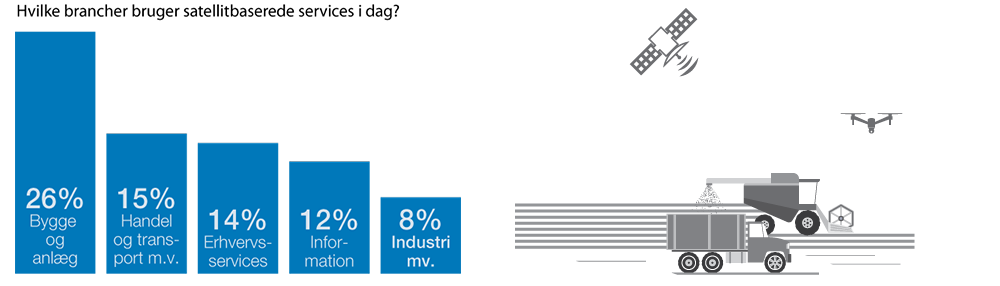
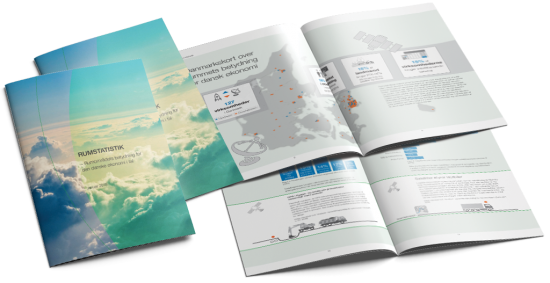
We was asked to develop the design and lay out the publication for the finishing result, which is a statistical inventory with many graphs, but also added several other graphic solutions to show the development, scope and possibilities. When working with statistics, graphs will be a natural part of the job. Because of this we focused on how to make them visually more simple and hopefully also easier to read.
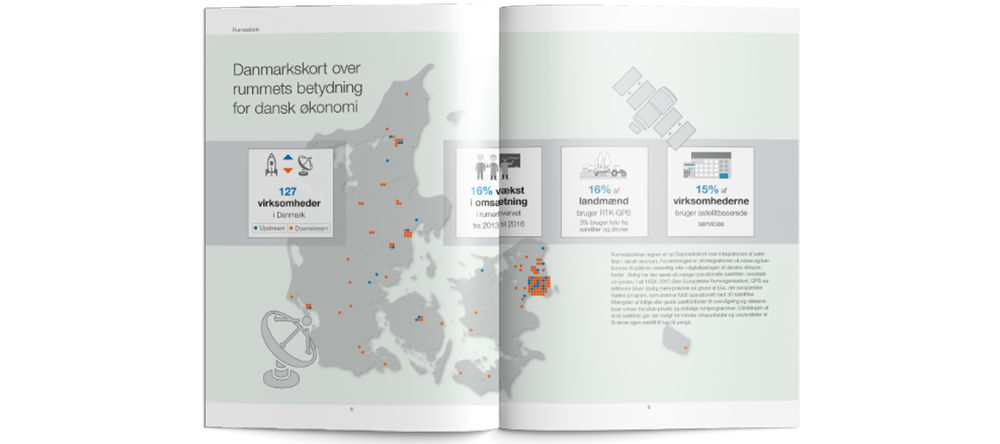
In addition, several info-graphics have been developed, which, contrary to graphs, try to show a development, direction or scope of possibilities. Info-graphics can make complex information easier to understand.
The purpose of all graphic work is to improve the readability and make the overall publication more accessible and interesting for more people. Denmark's Space Statistics 2018 is published by the Danish Agency for Research and Education (www.ufm.dk), and the statistics can be found at the 'Office for Space' www.brugrummet.dk.